We created the JAN3 Financial Charts page to be a living, breathing window into Bitcoin's global adoption. These aren’t just pretty graphs. They tell the story of the monetary revolution unfolding before our eyes. With the fastest ETF data updates and curated visualizations, this page empowers:
- Bitcoiners who want to understand market dynamics in real-time
- Analysts looking for up-to-date metrics and adoption trends
- Corporations & Governments seeking signal through the noise
- Anyone curious about the biggest shift in financial history
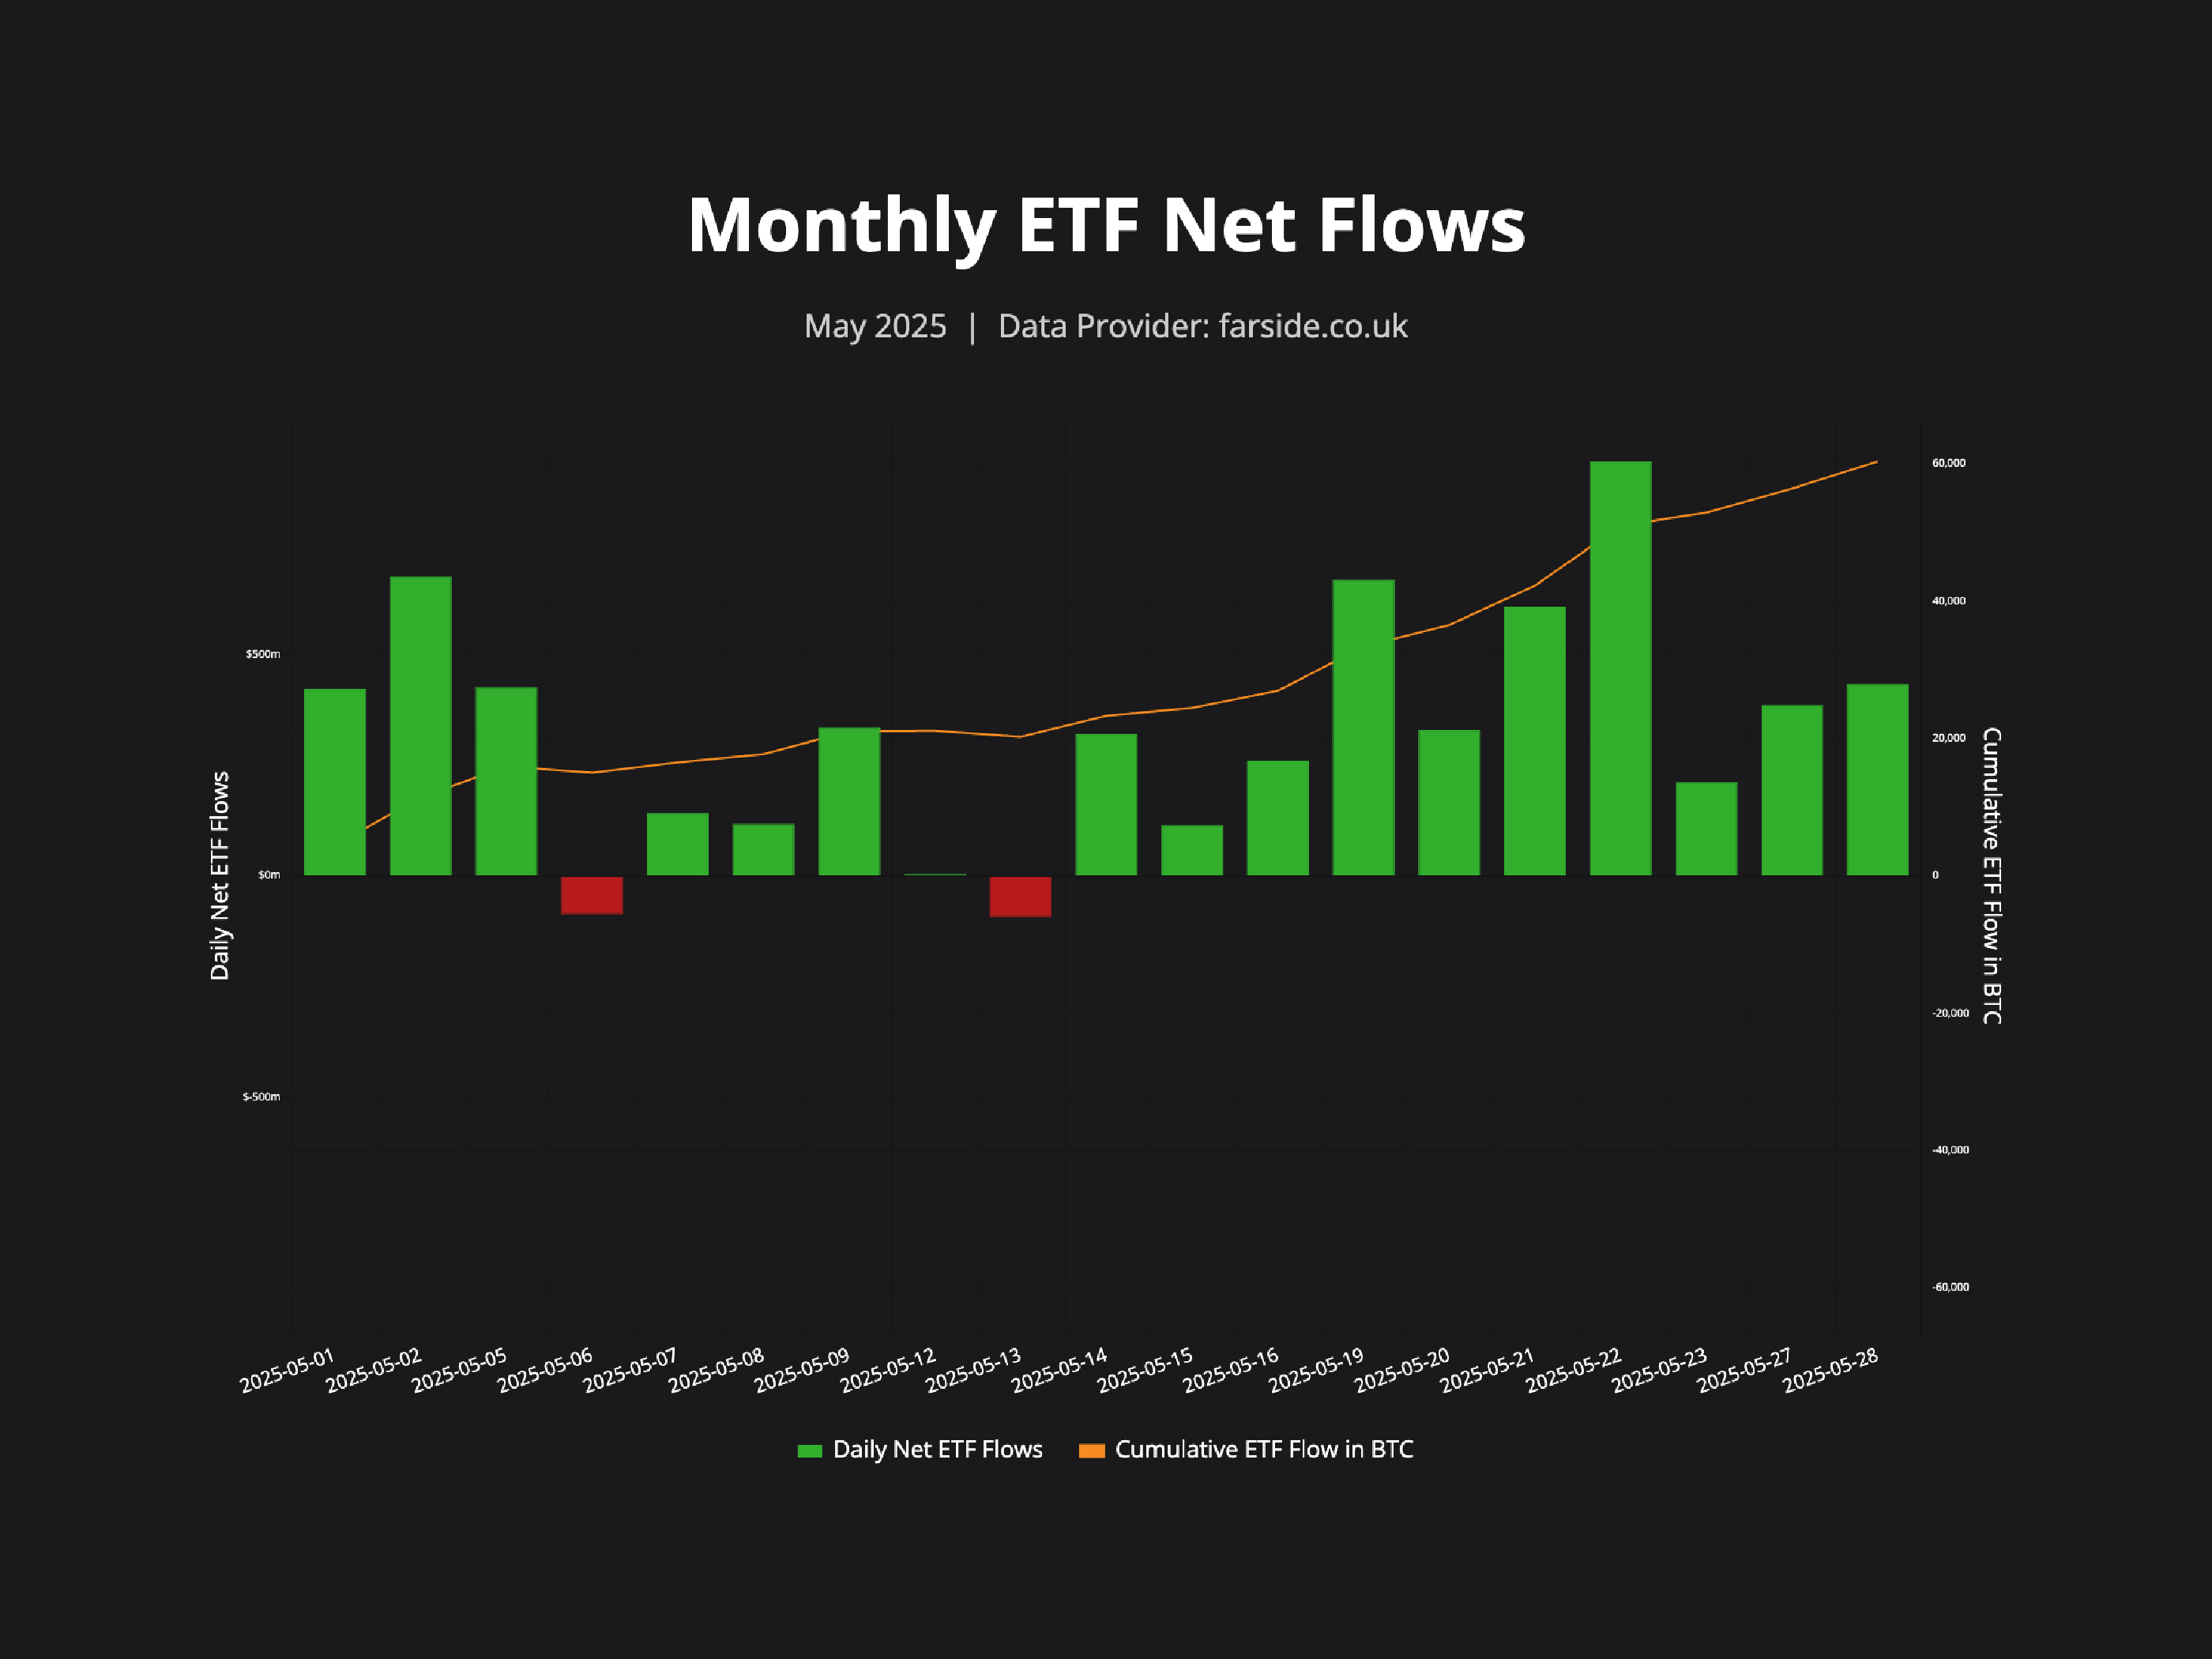
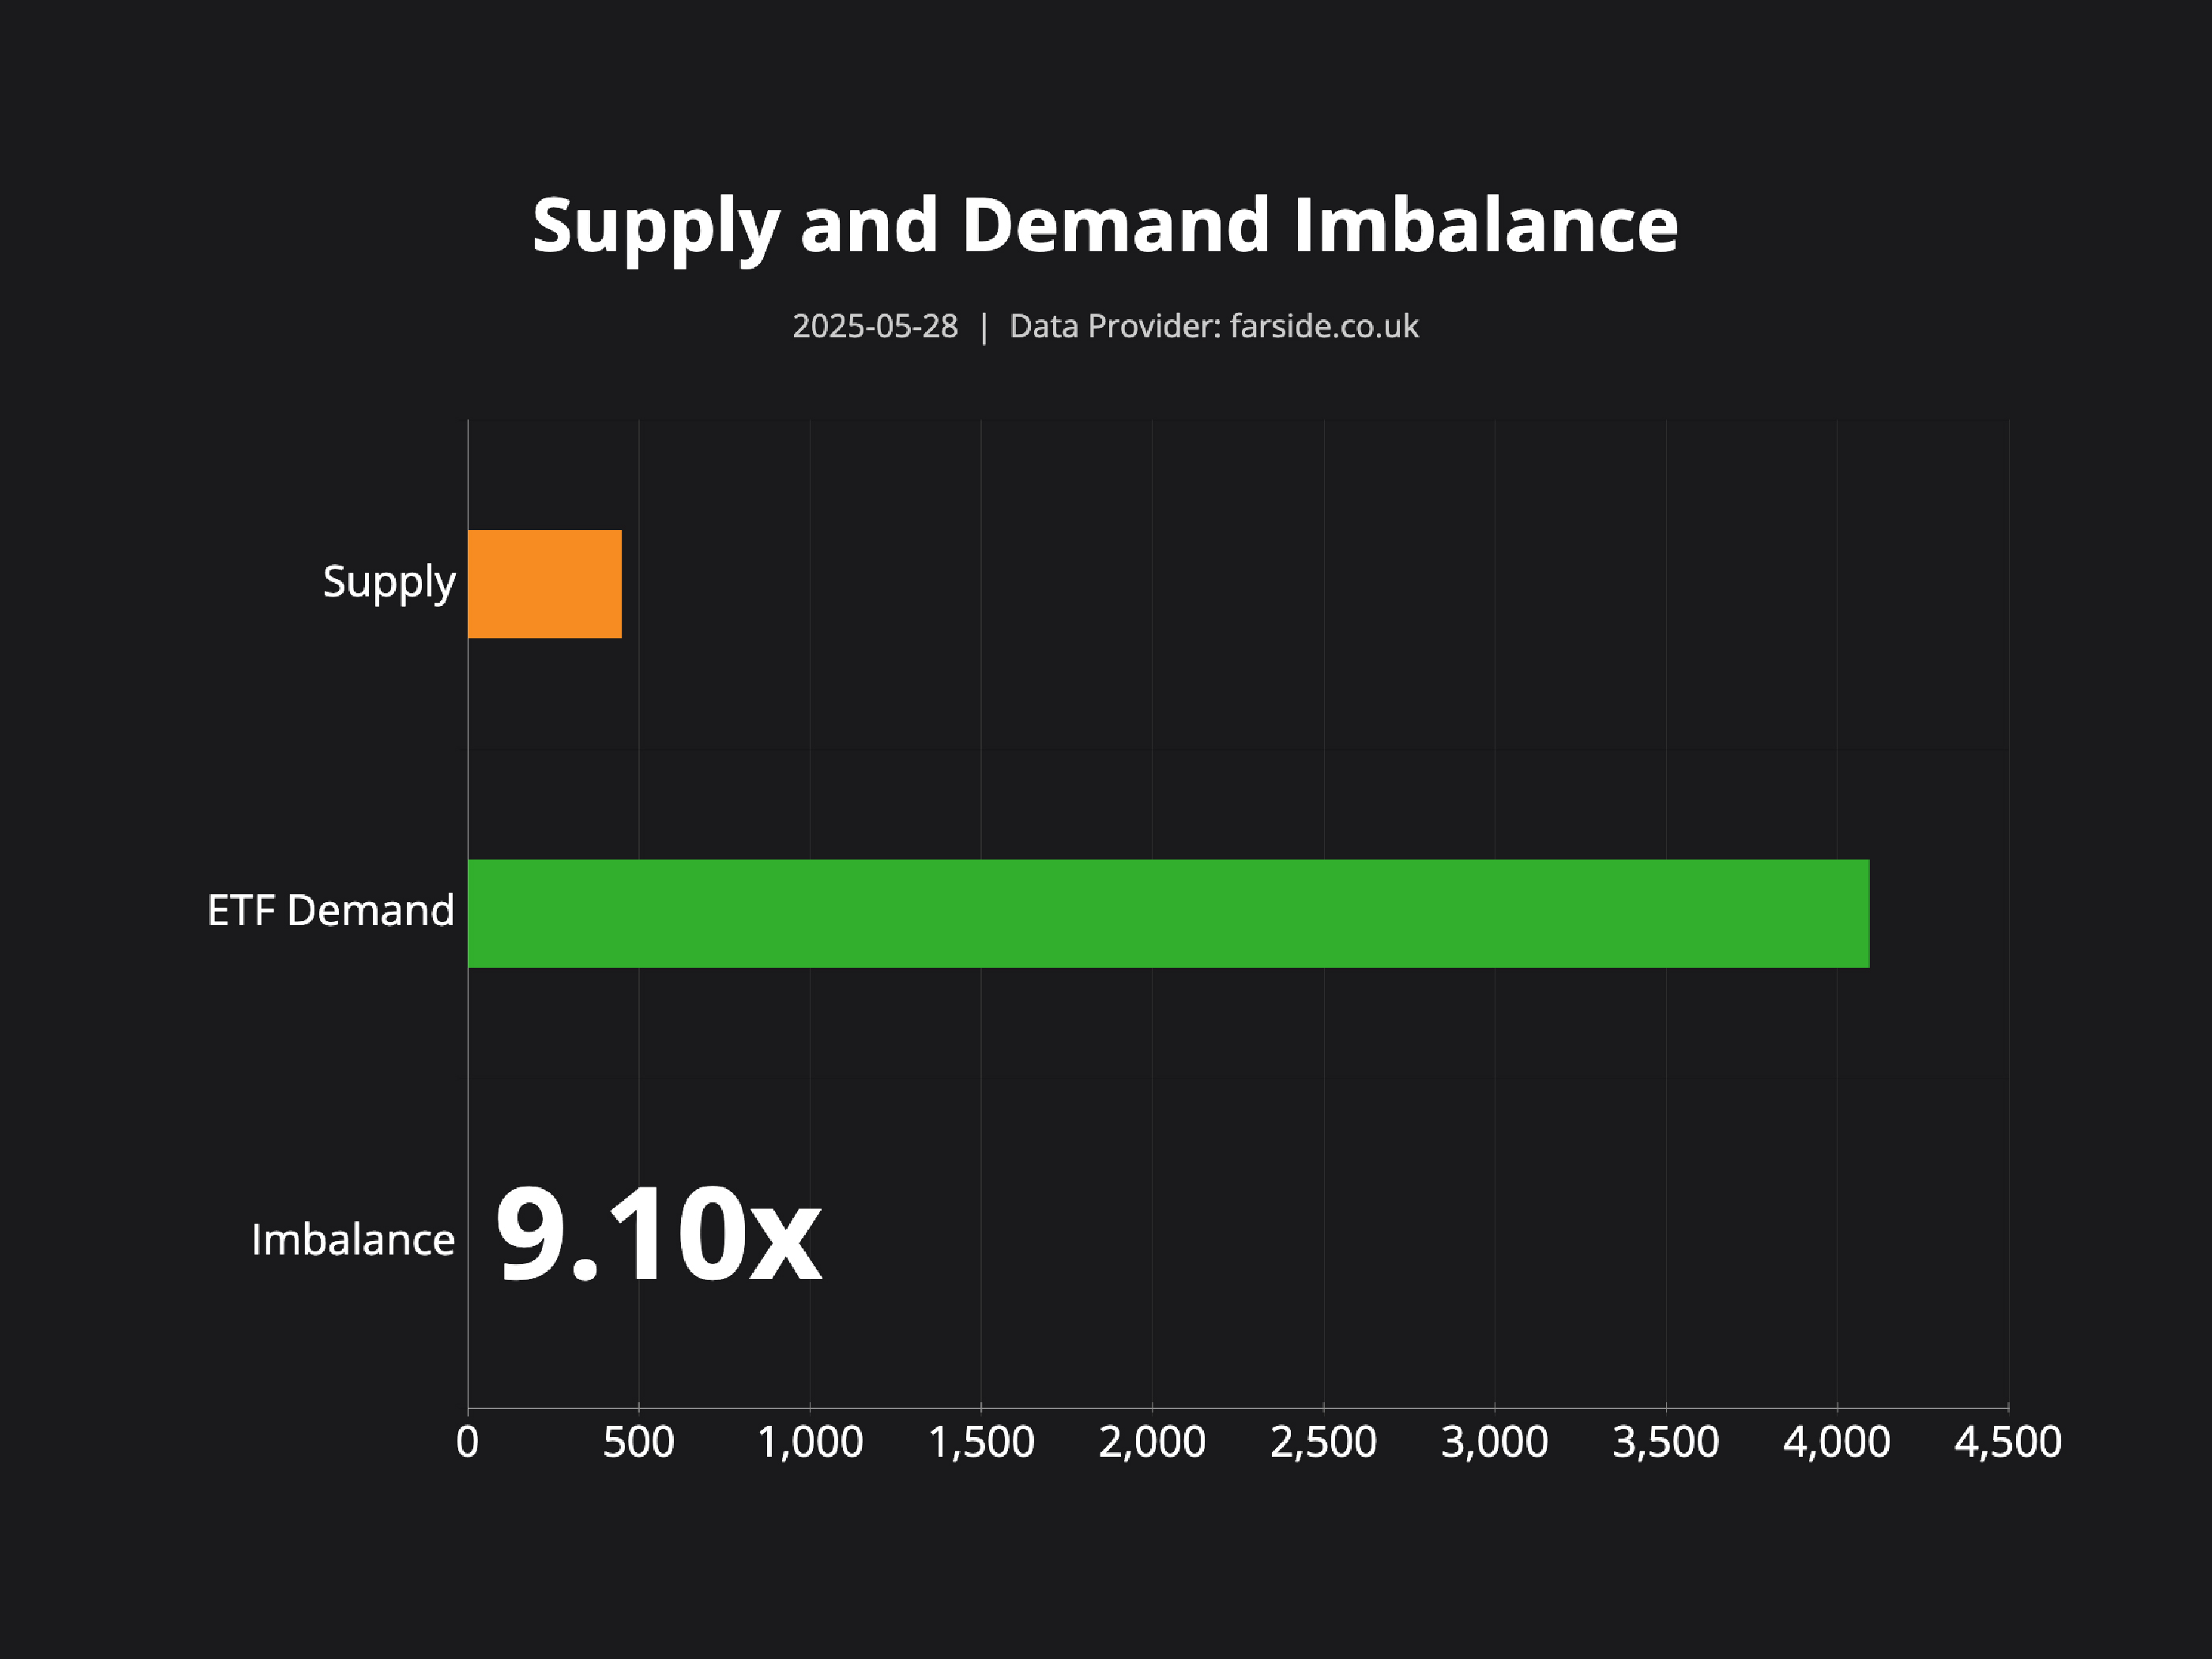
We offer a variety of charts that help you track Bitcoin ETF flows, Bitcoin price performance, and stablecoin trends across multiple timeframes. We have several unique charts, like Supply and Demand Imbalance, which compares newly mined Bitcoin with ETF activity to visualize market pressure. For ETF tracking, we provide daily, weekly, and monthly flow charts, including one with total ETF Flows and Cumulative Holdings, Monthly Net ETF Flows, and 14-Day Average ETF Flows in both BTC and USD. Stablecoin watchers can explore Tether AUM History and Tether Yearly AUM. All of these charts are easily exportable to PNGs or shareable directly to social platforms, including X, Facebook, and LinkedIn.
Our Charts
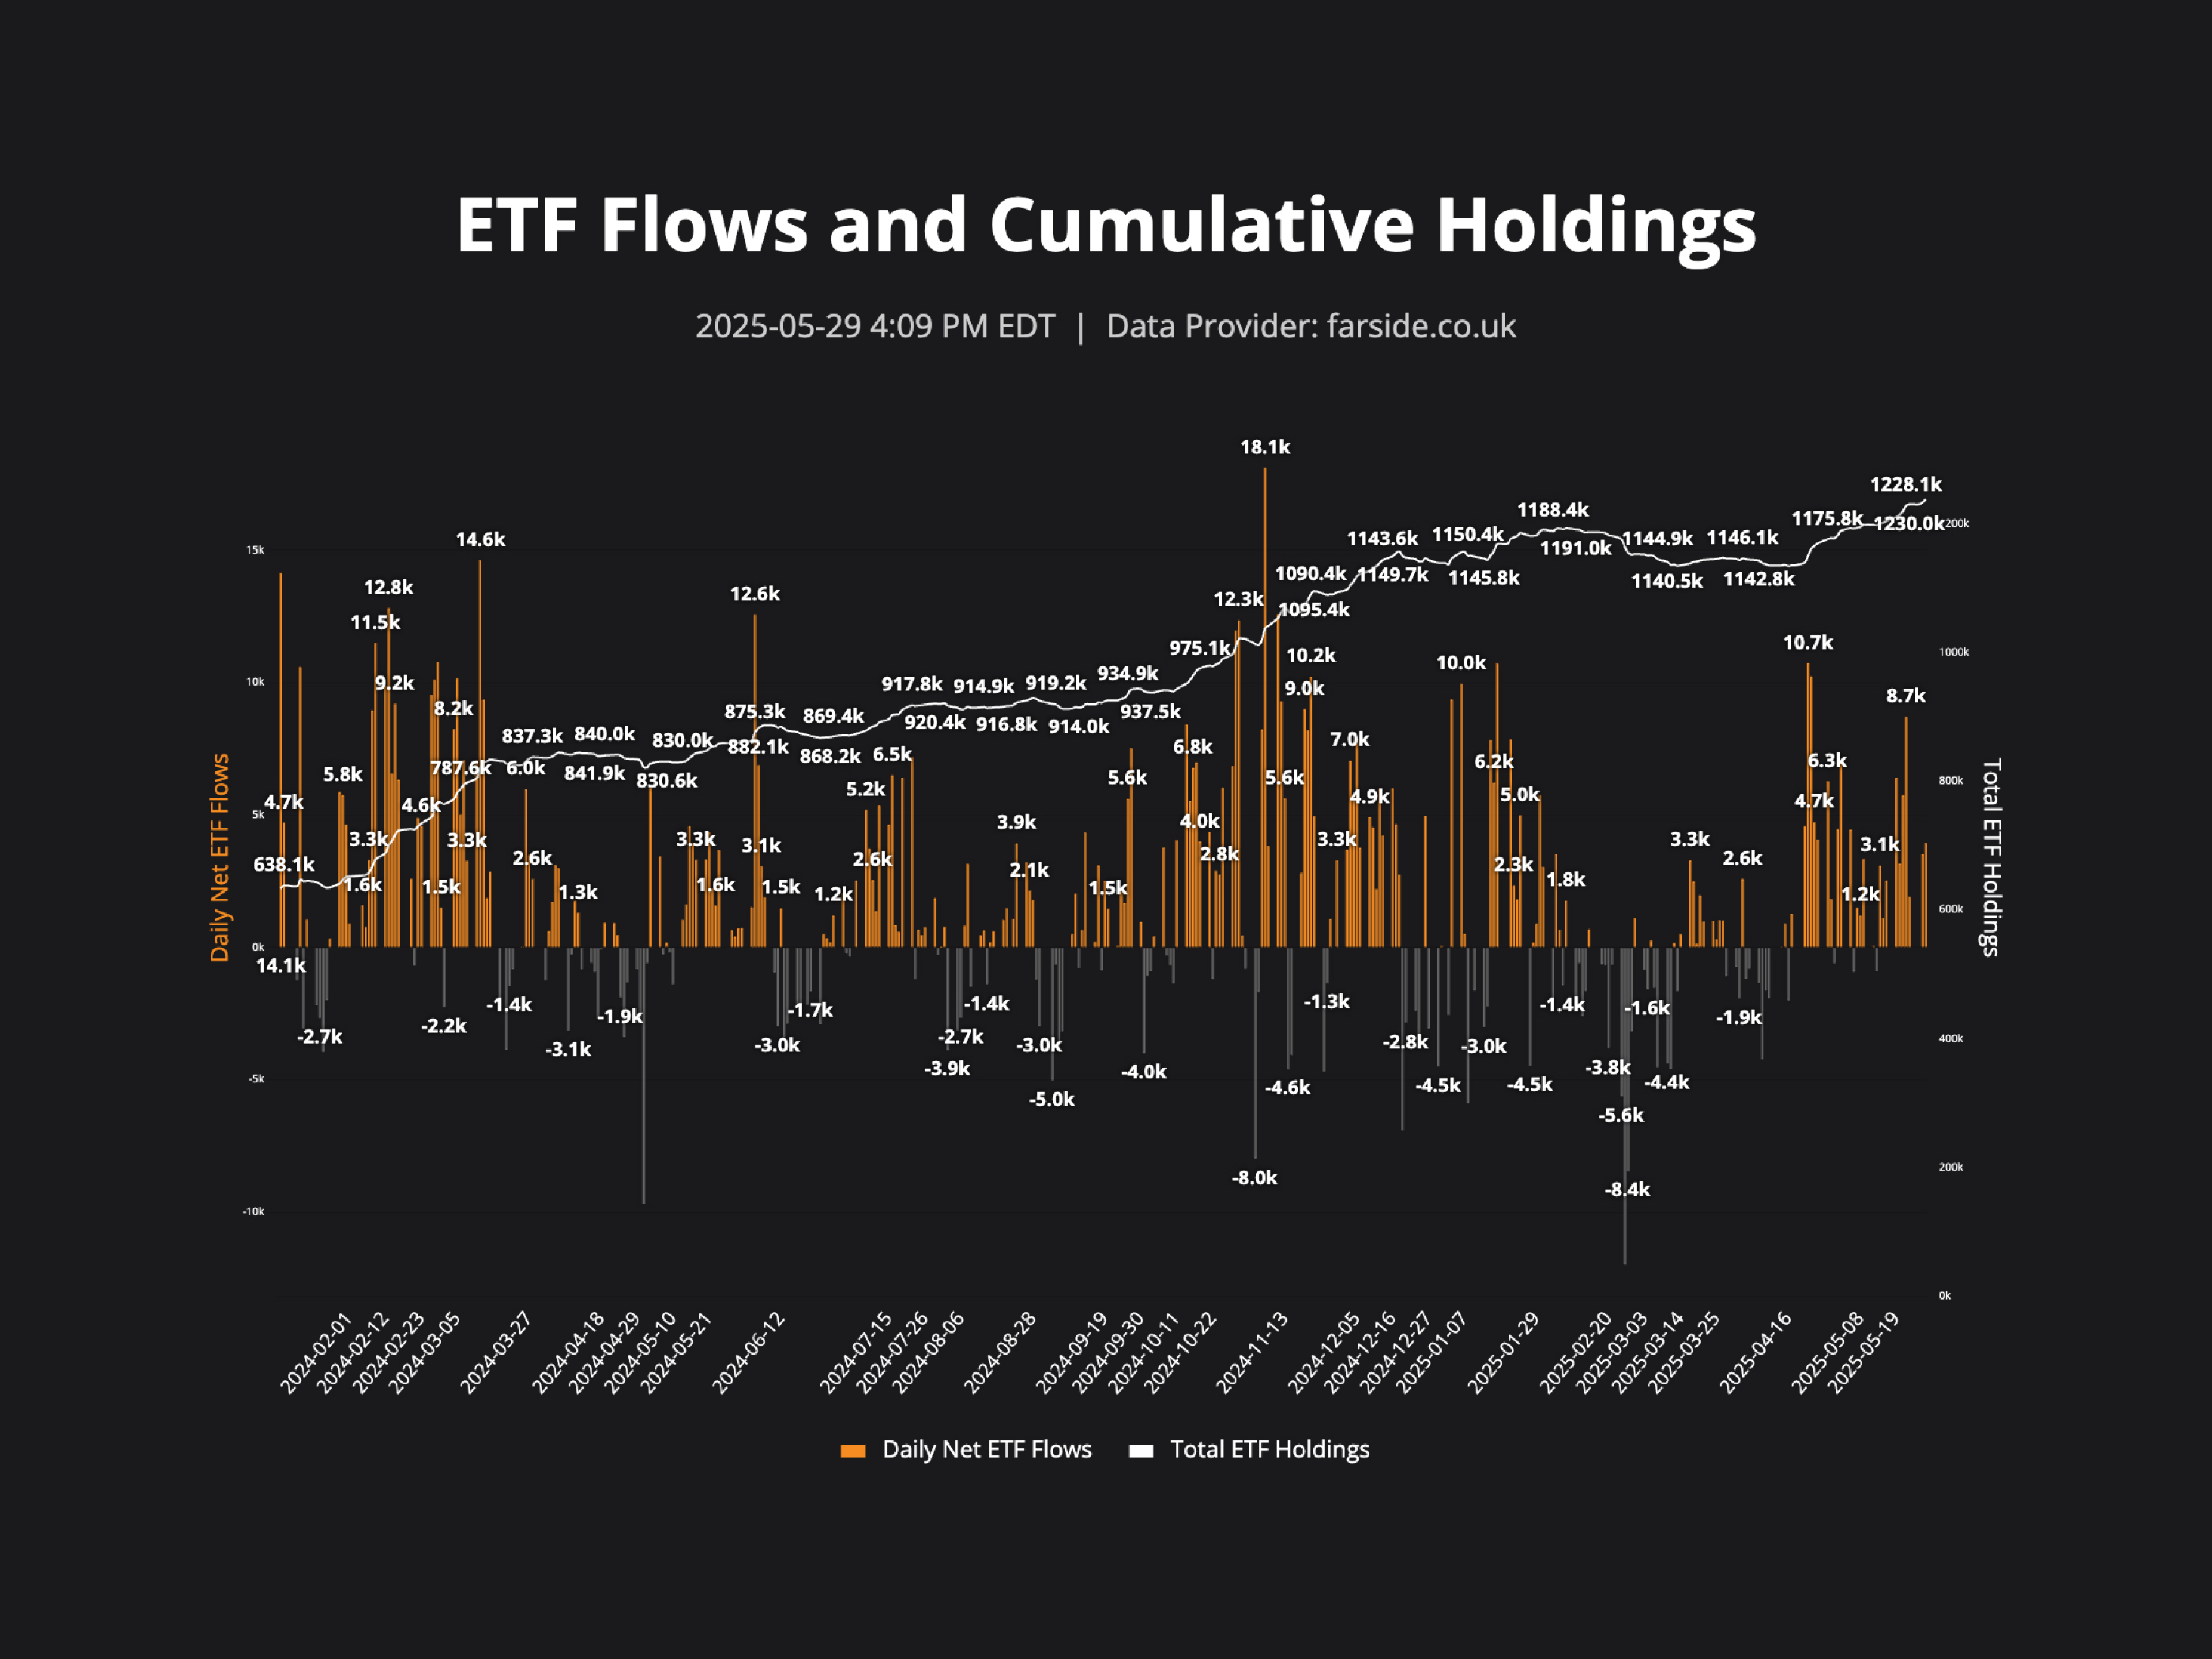
For the first time, the traditional financial world is going all-in on Bitcoin. The launch of Bitcoin ETFs has opened the floodgates to institutional capital. Our ETF Flows and Cumulative Holdings chart tracks the day-by-day tsunami of inflows into Bitcoin ETFs since launch. The game has changed; Bitcoin is now a financial primitive that every asset manager is scrambling to understand and integrate.
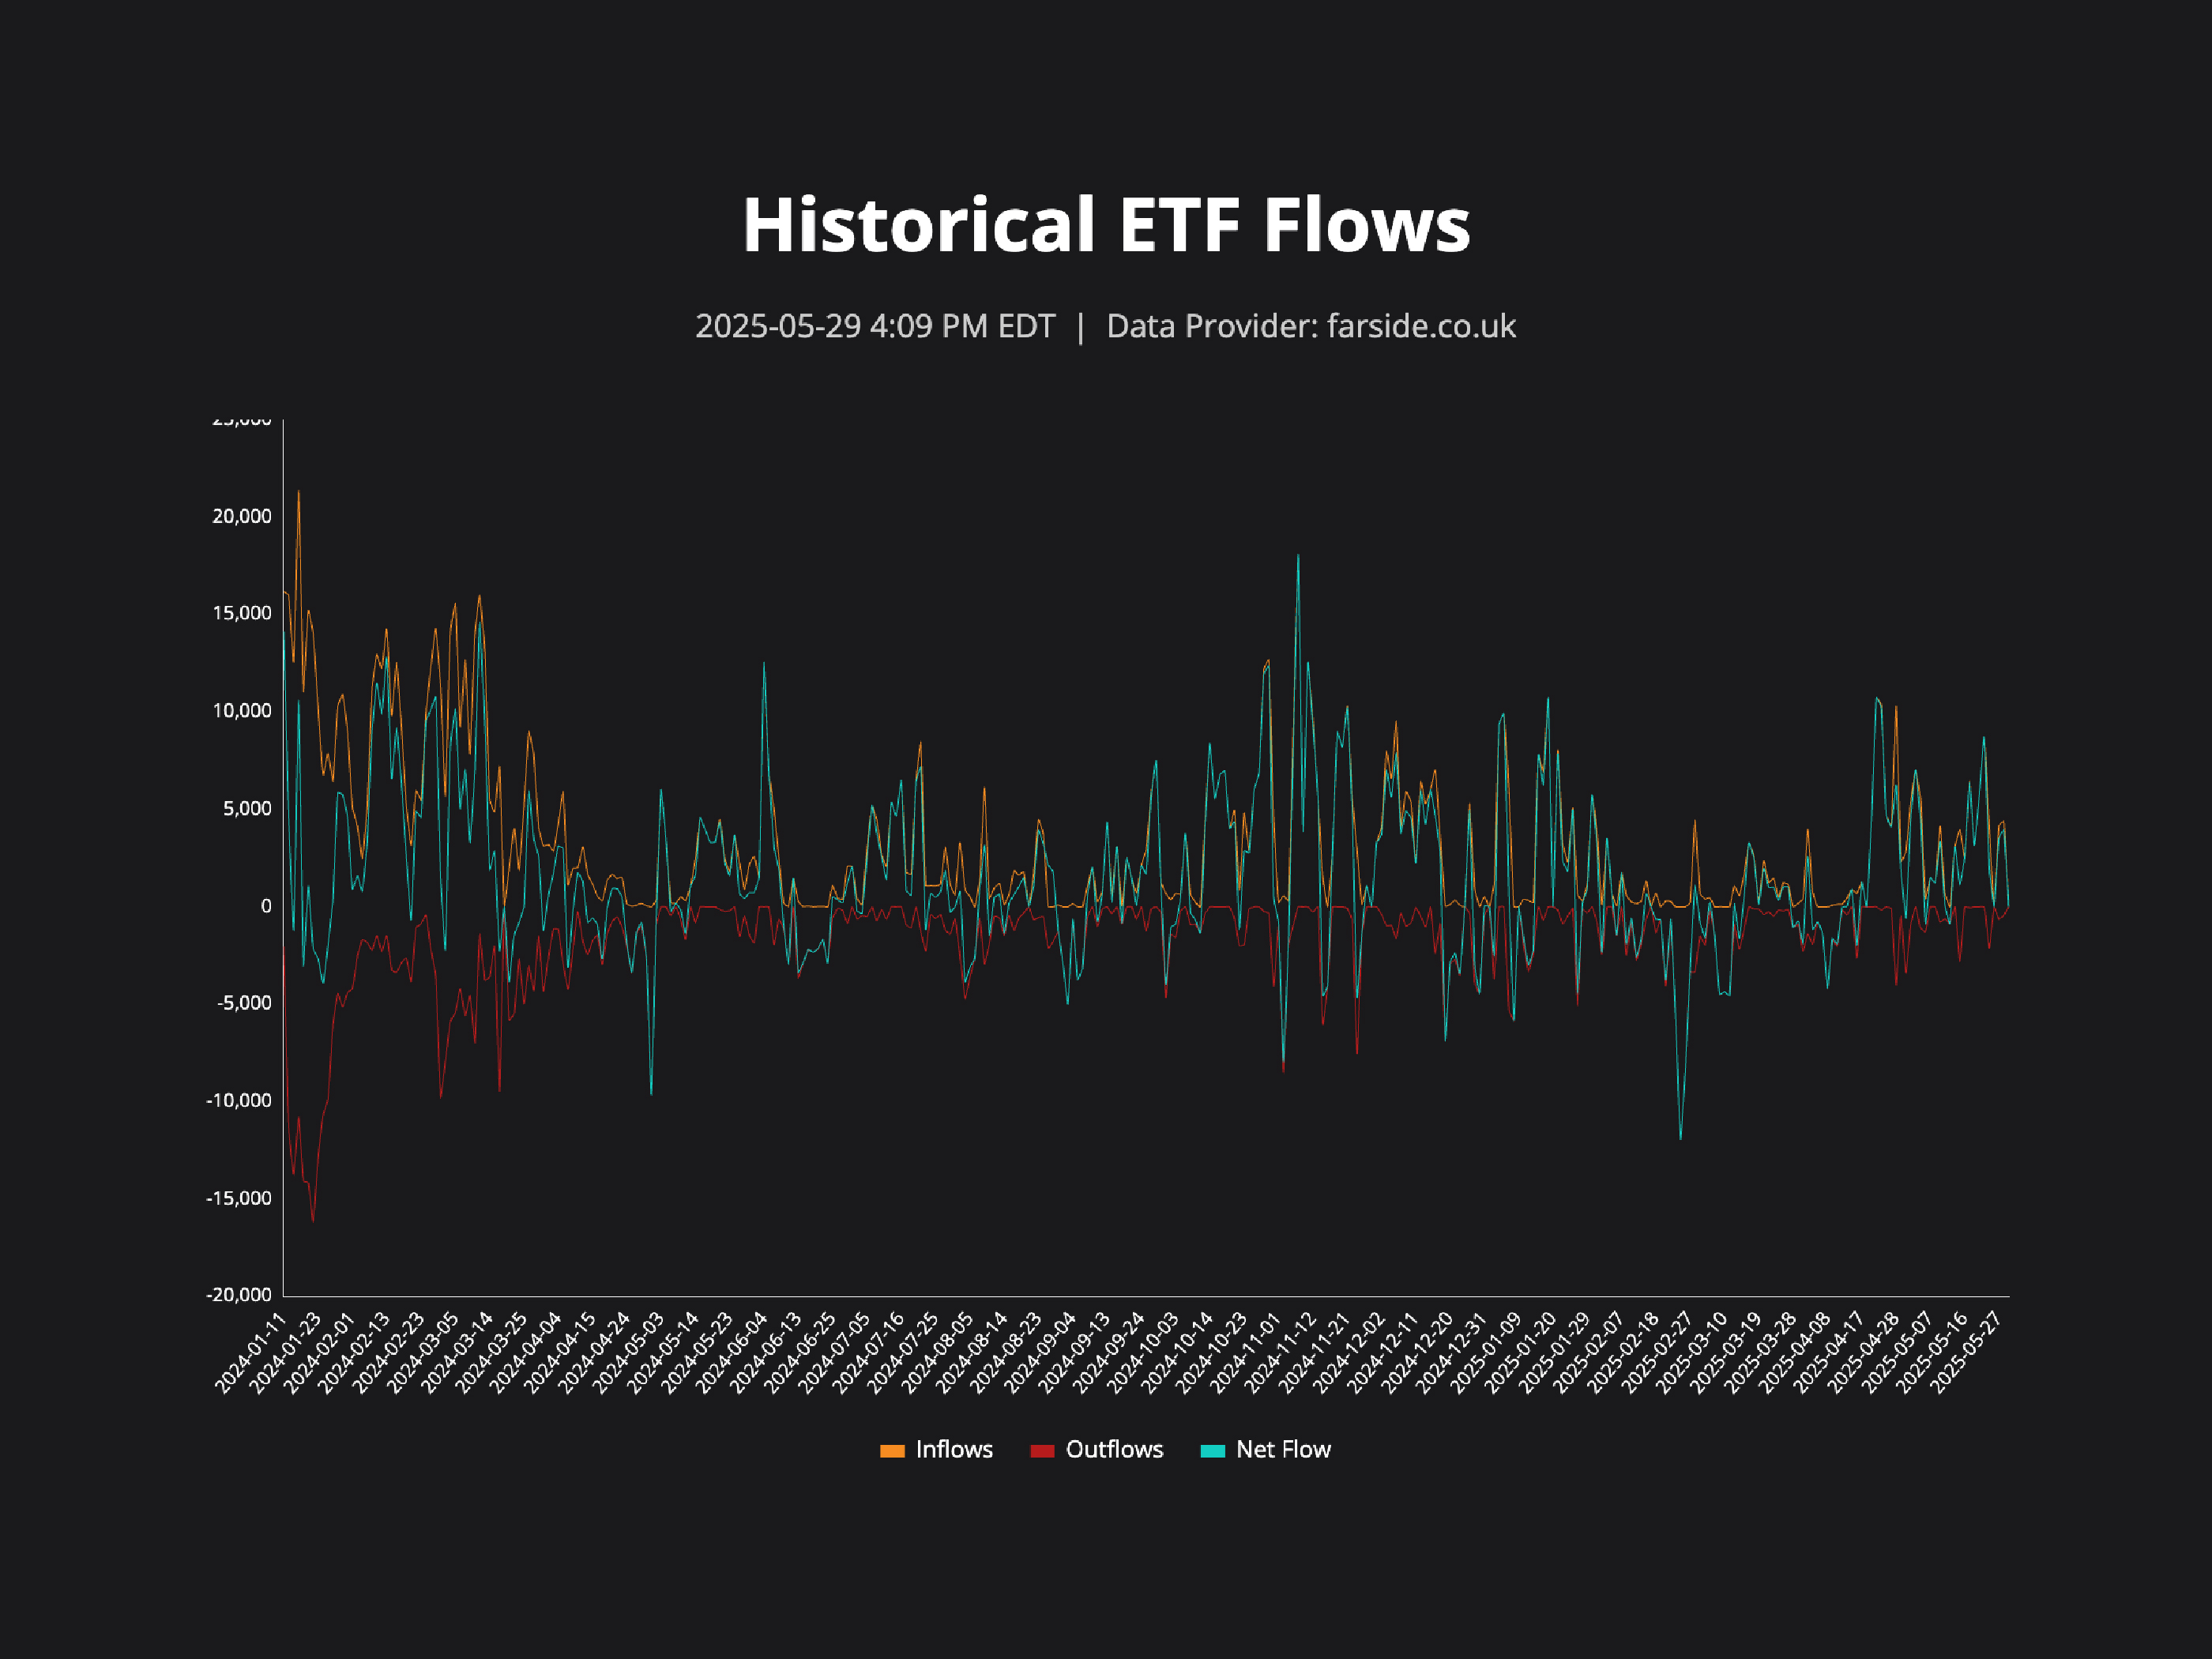
The Historical ETF Flows chart gives a more granular view of daily ETF behavior, revealing patterns in inflows and outflows over time. From key announcements to macroeconomic events, these movements show that institutional attention has firmly arrived and isn’t going away.
Our Monthly ETF Net Flows chart helps quantify this trend by showing net changes in Bitcoin holdings across ETFs. When inflows dominate, ETF providers must acquire Bitcoin on the open market, creating sustained upward pressure on price.
The Supply Shock is Coming
The Supply and Demand Imbalance chart says it all: ETF demand was 7.97x higher than daily mined supply on May 27th, 2025. This imbalance cannot persist without price appreciation. As institutional buyers compete for a dwindling amount of available Bitcoin, the dynamics of supply and demand become increasingly asymmetric.
JAN3 Financial Insight
This charts page is more than just a tool for analysts or investors. One of the main reasons we built it was to share clear and accessible data that shows where Bitcoin is going. This is a resource for individuals, institutions, and nation-states to better understand the long-term potential of Bitcoin in order to make confident, informed decisions about the role it can play in their economies.
From price models and ETF flows to unique metrics like the Supply and Demand Imbalance, this is your dashboard for the Bitcoin century.
We’re just getting started. Expect new models, more data, and powerful tools in the months ahead. Bookmark the page, share it with others, and use it to navigate the evolving world of Bitcoin with clarity and confidence.
Visit the charts page now: jan3.com/charts/


